Imagine working at a quantitative finance firm where more dollars move through the markets every day than I would earn in a lifetime, driven by both mannual and automated trading systems. The team isn't particularly large, but almost everyone is exceptionally good at what they do. And somehow, you're part of it.
Well, that's what happened to me.
I joined such a firm, it was a Singapore based single family office, as an engineer. At the time, the firm was exploring opportunities in blockchain based financial assets, particularly the possibility of combining information from natural language sources such as Twitter, podcasts, and news with actual transactions happening on blockchains.
I built a few MVPs to explore the idea. The team liked the results, and before long, I was tasked with something considerably larger: building a data platform where quantitative researchers could explore these datasets, test hypotheses, backtest trading strategies, and eventually run those strategies in near real time. Not high frequency trading, mind you. That's an entirely different engineering problem.
There was one complication, though. Nobody knew exactly what we were looking for yet. The research hadn't been done, we didn't know which datasets would prove useful, and we couldn't predict what questions the quants would want to ask six months down the line. We had to build the platform before we knew what people would discover using it.
That project became the Quant Stack. Over time, it grew to around 180 TB of managed data across multiple regions, processing over a billion events daily and supporting 12 data products. And suddenly I was in charge of making this a relaity.
Before going further, a note on confidentiality. I cannot disclose the trading strategies, proprietary research, or internal trading operations of the firm. What follows is an engineering focused reconstruction of the platform, informed by the system we built, the mistakes we made, and what I learned along the way. It is not an exact description of the firm's internal architecture.
So, what were we trying to solve?
Let's talk about crypto for a moment.
Unlike gold, which has physical uses and a long history as a store of value, many crypto assets are harder to value using traditional methods. There may be no earnings, cash flows, or underlying assets to anchor a valuation. A substantial part of the price can depend on what people believe the asset is worth, what they expect others to believe, and how those expectations change.
George Soros explored a related idea through his theory of reflexivity. In simple terms, people's perceptions can influence market prices, and those prices can, in turn, influence people's perceptions. I'm not here to argue which theory of asset valuation is correct. That's a much larger discussion, and I'm certainly not the right person to settle it. But the firm had a hypothesis: what if we could better understand market movements by studying how people evaluate an asset, what information they're consuming, what influential participants are saying, and what is actually happening in the market?
That sounds reasonably straightforward until you look at where all this information lives. In traditional finance, a substantial amount of information comes through established channels such as financial filings, earnings reports, research publications, and market data providers. Crypto is different. Some of the most influential voices aren't publishing research reports through investment banks. They're hosting podcasts, writing newsletters, posting long Twitter threads, or publishing technical blogs. Communities discuss projects openly on Twitter and Reddit, or in smaller groups on Discord and Telegram. Narratives form, spread, change, and sometimes disappear within days.
And then there's the blockchain itself. Most public blockchains expose transactions, wallet addresses, token transfers, smart contract interactions, and other on chain activity. You can see how assets move, which contracts people interact with, and how activity changes over time. Of course, a wallet isn't necessarily a person. One individual might control hundreds of wallets, while a single address might represent an exchange serving thousands of customers. Connecting those addresses to real world participants is a separate problem, often without a definitive answer.
Still, we had an unusual amount of observable information. We could study what people were saying, what information was circulating, and what participants were doing on chain. The interesting part was connecting those observations.
Suppose a researcher notices that a particular token is receiving unusual attention on Twitter. They might want to know whether influential accounts started discussing it, whether similar conversations appeared on Telegram, whether on chain transfers increased, and how the asset's price behaved afterward. Or perhaps the researcher wants to start with an unusual on chain transaction and work backward to see what information was circulating before it happened. These are illustrative research questions, not descriptions of the firm's trading strategies.
Answering them requires joining information from systems that were never designed to work together. A tweet, a podcast transcript, a token contract, a blockchain transaction, and a price observation have very different structures. They also have different notions of time, identity, completeness, and reliability. And we needed researchers to explore all of them without asking an engineer to build a new pipeline every time they had an idea.
The problem with not knowing what you're building for
Usually, when you build a data platform, you have at least some idea of how people intend to use it. A business might want sales reports, customer analytics, or operational dashboards. You can talk to stakeholders, understand the metrics they need, and design the data models around those requirements.
We didn't have that luxury. The quants were still figuring out which questions were worth asking. One researcher might want to analyze years of blockchain transactions. Another might want to correlate social media activity with token prices over a period of minutes. Someone else might want to experiment with sentiment models or investigate relationships between wallets and smart contracts. We couldn't predict all of those workloads in advance, and building a dedicated pipeline for every hypothesis would mean the engineering team became a bottleneck for research.
So the requirement was fairly simple to state, although much harder to implement. We needed a self service data platform where researchers could access historical data, combine datasets, run experiments, and reproduce their results. Engineers needed to add new data sources without rebuilding everything around them. And when research produced a useful signal, the platform needed a way to support its use in near real time trading systems.
That brought up several questions. How do we store hundreds of terabytes of data without making every research query prohibitively expensive? How do we process continuous streams of transactions and social media activity while also supporting historical analysis? How do we let researchers join information across completely different domains? How do we deal with late arriving data, duplicates, blockchain reorganizations, and changes in source schemas?
And perhaps most importantly, how do we make sure a backtest only uses information that would actually have been available at the time? That last question matters more than it might initially seem. A backtest can look remarkably profitable if historical data accidentally includes information from the future.
We needed a platform flexible enough for research, but reliable enough that researchers could trust what they were seeing. There wasn't going to be one database or one framework that solved all of this. We had to make choices about storage, compute, streaming, data modeling, and how different parts of the system would interact. Those choices would determine how much freedom researchers actually had.
Where the architecture begins
Before choosing technologies, I wanted to separate the problem into the workloads we needed to support.
Historical research required retaining large amounts of raw data, processing it repeatedly, and making it accessible through SQL and analytical tools. Researchers needed the freedom to revisit older datasets as their models changed. Real time processing had different requirements: data needed to arrive continuously, pass through transformations, and become available to downstream systems with predictable latency.
Then there was the analytical serving layer. Researchers and applications needed to query processed datasets without every request triggering a large historical computation. These workloads had different performance characteristics, failure modes, and cost profiles. Trying to force all of them through the same database and processing system would introduce compromises we weren't comfortable making.
The architecture eventually involved Apache Iceberg and object storage for the lakehouse, Spark for large scale batch processing, Trino for SQL access, Kafka and Flink for streaming. But that list doesn't explain much on its own. The interesting questions are why we needed those components, where the boundaries between them belonged, and which decisions we later had to reconsider.
That's where the actual engineering story starts.
The high level architecture
Figure 1: High-level architecture of the Quant Stack. An Apache Iceberg based lakehouse supporting batch and streaming data processing, with Spark and Trino providing distributed query capabilities. Apache Polaris manages the Iceberg catalog, while Apache Atlas and Ranger support metadata management and governance. Apache Airflow coordinates workflows, and platform wide operational services support reliability, data quality, and deployment.
The architecture revolves around one idea: separating data storage from the systems that process and query it. We needed researchers to work with large historical datasets without being tied to a particular processing engine. At the same time, we needed to process continuously arriving data, support historical backfills, and allow engineers to introduce new sources without disrupting existing workloads.
An Apache Iceberg lakehouse provides the shared storage foundation, organized into Bronze, Silver, and Gold layers. Kafka handles event transport, Flink processes continuous streams, and Spark handles historical transformations and backfills. For research, both Spark and Trino can query the underlying Iceberg tables, depending on the nature of the workload.
The other important requirement was self service access. A data platform isn't particularly useful if every research question requires assistance from the engineering team. Apache Polaris provides the Iceberg catalog, while Atlas and Ranger support metadata discovery and governance. Internal SDKs give researchers a more convenient way to interact with the platform.
Of course, putting these systems together is the easy part to describe. Deciding where their responsibilities begin and end, how data moves between them, and what happens when something fails is where most of the engineering work lies.
Why a Lakehouse? Why Spark? Why Not dbt and a Data Warehouse?
During the initial MVP, we started with ClickHouse and dbt. I was already familiar with both from my previous experience, and they allowed us to get the job done. At that stage, we didn't need anything more complicated. We just needed to prove that the idea could deliver business value. However, once we started expanding from the MVP into the broader Quant Stack, we ran into several limitations.
The first was scaling and resource isolation. With dbt, transformations were primarily SQL based and executed within ClickHouse. Researchers and quants queried the same warehouse, and dashboards used by traders also depended on it. That meant ELT pipelines, exploratory research, and trading related queries were competing for the same resources. ClickHouse is a very good technology, but like any wharehouse, it has strengths and limitations depending on the workload. At our peak, we operated three ClickHouse clusters across more than 30 dedicated servers rented from Hetzner and Netcup. Problems arose when researchers needed to run expensive queries while traders needed ad hoc analysis and background ELT pipelines were still running.
ClickHouse does provide resource controls. We could impose limits on individual queries and configure different restrictions for ETL, research, and trading workloads. But those controls didn't give us the granularity we wanted, particularly when it came to allocating compute independently to different workloads.
The more significant limitation was how storage and compute were coupled in our ClickHouse deployment. Data was distributed across the cluster, and compute capacity was tied to where that data lived. Adding another node didn't automatically mean we could take full advantage of its compute resources. We also had to consider redistributing data, which meant network transfers. And as anyone working with large datasets knows, moving data across a network can become expensive very quickly. We looked into other analytical warehouses too, particularly StarRocks, which offered a different approach to separating storage and compute.
Storage growth was a major concern too. ClickHouse supports hot and cold storage configurations, so frequently accessed data can remain on SSDs while older data moves to slower disks. That's useful, but we were ingesting ever growing blockchain histories across six chains, and storage capacity was becoming a problem of its own. We could have used S3-backed storage with ClickHouse, but at that point we started questioning whether a warehouse centered architecture was still the right foundation. If we were moving historical storage to object storage anyway, a lakehouse was worth evaluating.
The biggest limitation became obvious when we started working with Solana. Based on our estimates using Google's BigQuery dataset, Solana's historical raw data was approaching the petabyte scale. Our existing backfill process took approximately nine hours per epoch. That was a problem because researchers had identified an opportunity they wanted to investigate, and they needed historical data to backtest their hypothesis. At nine hours per epoch, completing the backfill would have taken months.
To be clear, this wasn't simply because ClickHouse or dbt was slow. Our transformations were expensive, and some of the execution time came from decisions we had made ourselves. The workflow processed data incrementally by epoch, and while its real time throughput was sufficient for our needs, historical backfills were a different story. We could have optimized the existing transformations further. But the underlying problem remained: scaling compute independently was difficult. Adding nodes meant reconsidering data placement, distribution, and cluster configuration. We wanted to allocate additional compute to a backfill when necessary, then release those resources when the job finished, without reorganizing the warehouse around it.
That coupling between storage and compute was the main reason we began looking seriously at alternatives.
Another challenge was the transformation model itself. dbt is primarily SQL based, and SQL is excellent for many analytical transformations. But not everything we needed to do was naturally or efficiently expressed in SQL, especially when working with raw blockchain logs and more complex processing. We had developed approaches around those limitations, including ClickHouse UDFs. Some transformations used UDFs, and we even ran NLP inference through Python UDFs inside ClickHouse. Yes, you can run AI models from ClickHouse using Python UDFs, and it worked for our use cases. But operating those workloads inside the warehouse wasn't always the best fit. With Spark, we could express those transformations in Python or SQL, use distributed processing primitives directly, and integrate machine learning workloads more naturally. We also had more control over partitioning, execution, and how compute resources were allocated.
Then there was governance.
ClickHouse provided access controls and policies, so it wasn't that governance was impossible. The problem was the amount of work required to manage it consistently across our growing platform. We were building a self service environment where different researchers, engineers, and trading applications needed access to different datasets, and we needed to maintain visibility into who could access what. We were familiar with more centralized approaches to data governance, including the access control models popularized by platforms such as Databricks Unity Catalog. Given that self service access was one of our core requirements, governance and auditability couldn't remain an afterthought.
We could have built more of that infrastructure around ClickHouse, but it increasingly felt like we were adding custom systems to compensate for limitations in our architecture. There was also a smaller issue with dbt. At the time, the distributed ClickHouse connector was still in beta. We tested it, it worked, and we used it, but relying on a beta integration for an increasingly important part of the platform was another consideration. I'm not sure how much that has changed since then.
Client-side access introduced another problem. Our researchers were comfortable with SQL, and we used it extensively during the early phases. But SQL wasn't always the interface they wanted for their work. Many preferred Python based workflows and lower level control over their transformations. As a result, researchers sometimes copied datasets from ClickHouse into isolated research environments and processed them locally using Python tools. That created problems beyond unnecessary data movement.
Once a dataset was copied into a researcher's VDI, enforcing access restrictions became much harder. What happened if access needed to be revoked? What if we discovered a data quality issue and needed to contain a particular dataset? The original permissions could be changed, but the exported copies were already outside our centrally managed data environment. We needed a way to bring compute closer to the data without taking away the flexibility researchers were accustomed to.
This is where the lakehouse architecture made a meaningful difference. By separating storage from compute, we could provision resources for individual workloads rather than scaling the entire warehouse. Large backfills could run on dedicated Spark compute, while researchers continued querying data through separate Spark or Trino workloads. We could also run multiple backfills in parallel, subject to the available infrastructure and resource quotas, without forcing them to compete within the same warehouse cluster.
For Solana, the combination of this architecture and substantial transformation optimizations brought our per-epoch backfill time down from approximately nine hours to one hour and 48 minutes, an 80% reduction. Of course, that doesn't mean migrating from dbt and ClickHouse to Spark automatically makes everything five times faster. Our workload was specific, and we made significant changes to how the data was processed. Some of those optimizations could also have improved the original implementation. But the new architecture gave us more freedom to optimize and scale the workload without being constrained by the warehouse's storage layout.
The benefits extended beyond backfills. Spark gave researchers an interactive environment where they could work with large datasets using Python and SQL without first downloading them into their own research machines. It was closer to the workflows they were already familiar with through Pandas, while allowing computations to run on distributed infrastructure. Its machine learning ecosystem was also useful for our NLP workloads. For our research and data science teams, this made a real difference. They could work directly against centrally managed datasets, use more flexible processing tools, and avoid exporting large amounts of data just to experiment.
It also made governance easier to enforce. By running compute in centrally controlled environments, we could manage access at the platform level rather than trying to track copies of datasets scattered across individual VDIs. We used Apache Ranger and Atlas for access governance, metadata discovery, and lineage, with the necessary integrations into the platform.
Kubernetes gave us another option for scaling batch compute. When needed, we could provision additional resources for Spark workloads, including spot instances from Rackspace, and scale them down afterward. That helped us avoid keeping large amounts of compute capacity idle between backfill jobs.
Ultimately, the reason we moved toward a lakehouse wasn't that ClickHouse or dbt had failed us. They had served the MVP well and helped us prove the business case.
But the requirements had changed. We were no longer building a handful of pipelines around a warehouse. We were building a shared research platform supporting different workloads, unpredictable queries, large historical backfills, and multiple teams working simultaneously. Separating storage from compute gave us more flexibility in how we provisioned resources, while Spark and Trino allowed researchers to use the same underlying data through different execution engines. Centralized governance and compute reduced our reliance on locally copied datasets, and the architecture made it easier to scale expensive workloads independently.
As the platform's principal architect, I led the evaluation of the lakehouse approach with the engineering team and research stakeholders. We chose to separate historical storage from compute, while retaining ClickHouse for workloads where its serving performance remained valuable. For the kind of platform we were building, those trade offs made more sense.
Designing the Data Products
Choosing a lakehouse solved some of our infrastructure problems, but there was still the question of how to organize the data itself. We had twelve data products covering everything from blockchain transactions to Twitter, Reddit, Telegram, Discord, newsletters, and other natural language sources. Each had its own way of producing data, its own structure, and its own problems. The only thing they had in common was that our researchers wanted to analyze them together.
Take blockchain data, for example. For EVM compatible chains, we consumed streams of blocks, transactions, and logs. Solana was different; we used a gRPC based stream to collect its transactions and related events. Social media was another story entirely. Twitter and Reddit required a combination of APIs and scraping, while Discord and Telegram used listeners. Newsletters were collected through an email watcher.
Despite these differences, the overall ingestion pattern was similar. Each collector published records into Kafka (or if realtime was not needed then to s3 directly in batches), from where they followed two paths: one into S3 for historical storage and another into Flink for real time processing.
Data not gathered today is lost forever
One decision we made early was to preserve the source data before applying heavier transformations. Data if not gathered today cannot be gathered tommorow with same precision and that was even more true for financial and social media data. For blockchain, that meant retaining blocks, transactions, logs, and other records collected from the networks. For social media, we stored the parsed responses from APIs, scrapers, and listeners, along with the source specific information we needed.
There was a reason for doing this. We didn't know which fields researchers would eventually find useful, and we didn't want the decisions made by an ingestion pipeline to permanently limit what could be analyzed later. Suppose we initially extracted only token transfers from EVM logs. Six months later, a researcher might want to investigate interactions with a particular smart contract or analyze an event type we hadn't considered important. If we had discarded the original logs during ingestion, recovering that information would mean fetching the historical data again, assuming it was still available (ahem solana ahem) or say how likes for a post evolved over time in twitter.
Keeping those records gave us the ability to revisit earlier decisions, develop new transformations, and rebuild downstream datasets without always returning to the original source. It also mattered when something went wrong. A parsing bug or incorrect transformation didn't necessarily mean we had to recollect everything. We could correct the processing logic and work from the historical records already stored in S3.
Of course, preserving source data came with a cost. Storage kept growing, especially with blockchain data, and we needed to think carefully about retention, partitioning, and how those records would be processed efficiently. But for a research platform where future requirements were largely unknown, we felt that trade off was worthwhile. Turning Raw Data into Something Researchers Could Use
Storing the data was only the beginning. A directory full of blockchain logs, social media responses, and newsletter content isn't particularly useful to someone trying to test a quantitative hypothesis. Researchers needed datasets they could query without having to understand every source's internal format. This is where the lakehouse's Bronze, Silver, and Gold layers came into the picture.
Bronze represented the source level data we retained. Silver was where source specific records could be cleaned, decoded, normalized, and validated. Gold contained datasets prepared for research and downstream applications. For EVM data, a useful progression might look like this: raw transactions and event logs in Bronze, decoded contract events and normalized token transfers in Silver, and research oriented aggregates or features in Gold.
Natural-language data needed a different set of transformations. A Twitter post or newsletter could be cleaned, enriched with extracted asset mentions, or processed through NLP models before becoming useful for quantitative analysis. These transformations didn't all need to run in the same way. Flink handled continuous processing where freshness mattered, while Spark handled larger historical transformations, enrichment, and backfills. Both could contribute to datasets stored in the lakehouse.
The important part was keeping the storage and processing concerns separate. Researchers didn't need to know which ingestion method or compute engine produced a dataset. They needed to know what the dataset represented, how reliable it was, and how to use it.
The Cross Source Entity Resolution and Record Linkage problem
The more interesting problem was making these datasets useful together. A blockchain transaction and a Twitter post don't share much in terms of structure. One might reference a token contract address, while the other simply mentions an asset by name or ticker. Even something as basic as identifying which asset a post refers to can be ambiguous.
Consider a researcher looking into a token mentioned on Twitter. They might want to examine its on chain activity, compare it with historical price movements, or investigate whether similar discussions were happening elsewhere. To support that kind of research, storing all the records in one place wasn't enough. We needed consistent identifiers, metadata, and a way to connect observations across sources. And we couldn't assume every relationship was correct. A ticker could refer to multiple assets, the same asset could exist across multiple chains, and a wallet address didn't necessarily correspond to a single person. These ambiguities had to be accounted for in the data model rather than hidden behind joins that happened to return results.
This was one of the reasons we needed to treated entity resolution as a platform level concern rather than leaving every researcher to solve the same problems independently. It was also one of the most challenging, and frankly, enjoyable parts of building the entire platform.
We needed a centralized entity layer that could connect references across natural language sources, blockchain activity, and market data. For natural language processing, we fine tuned a ModernBERT model to identify asset references in unstructured text. But extracting a name or ticker was only half the problem. We still had to determine which specific asset the author was referring to. For that, we considered context beyond the individual mention, including the author's historical references, the asset's popularity, and relevant market and on chain activity. A mention of a common ticker could refer to several different contracts, and choosing the wrong one could introduce errors into every downstream analysis built on that relationship.
There was also the question of time. An entity resolution that looks obvious today might not have been obvious six months ago. We needed references that could be used in real time processing while also supporting historical backtesting without introducing information that wasn't available at the time. Otherwise, a model could appear accurate in historical tests simply because it benefited from knowledge acquired later.
On chain entity resolution introduced a different set of problems. A single trader or trading firm might operate through multiple wallets, across several blockchains, and through intermediaries. We needed ways to correlate related activity by examining funding sources, transaction patterns, cross chain transfers, bridge activity, graph analysis and other available signals. Even then, linking addresses to a common entity wasn't always definitive, so uncertainty was something we had to account for.
Due to confidentiality, I can't go into the specific resolution algorithms, heuristics, or models used internally at the firm. The approaches described here are a high level account of the engineering problems we worked on, rather than a complete explanation of our implementation.
What I can say is that entity resolution turned out to be much more than a preprocessing step. It was a shared capability that allowed researchers to work across otherwise disconnected datasets without independently rebuilding the same relationships. Getting those relationships right, and knowing when we couldn't establish them reliably, was just as important as making the underlying data available.
Data Correctness and Reliability
Getting data into the lakehouse was one problem. Making sure researchers could trust it was another. We were processing over a billion events daily from blockchains, social media, news, and other sources. At that scale, something was almost always going wrong somewhere. An upstream API could change its response, a scraper could stop working, a smart contract could change its implementation (proxy contract could change upstream address), or a blockchain could reorganize. Some failures were obvious, while others were much harder to notice.
The particularly troublesome ones were when everything appeared to be working. Records were arriving, transformations completed, and queries returned results. Yet the underlying data was incorrect. In quantitative research, those mistakes can have consequences well beyond a broken dashboard. An incorrect observation could influence a research hypothesis, distort a historical backtest, or end up in a downstream trading system. We needed to know not only whether our pipelines were running, but also whether the data they produced was reliable.
A few incidents taught us why those are two very different problems. When the Pipeline Works but the Data Is Wrong
One of the more interesting data quality incidents we encountered involved Twitter engagement metrics. We collected Twitter data from public facing endpoints at relatively high frequency. For selected high value accounts, we also maintained a separate, lower frequency collection through an API. This gave us two sources of observations, although the public facing collection provided much more frequent updates.
At some point, Twitter changed how certain engagement metrics were exposed through its public interfaces. The view counts we collected became substantially lower than the values visible through alternate access. We didn't catch it immediately. The pipelines continued running, records arrived normally, and nothing was obviously wrong with the response structure. We had assumed the values returned by the source were accurate, and lower engagement wasn't necessarily unusual. It was our researchers who first noticed the anomaly and brought it to our attention.
During the investigation, we compared the affected records against historical observations and our independently collected API data for selected accounts. The discrepancy was clear: the public facing metrics were reporting significantly lower values. We traced when the behavior had started and contained the affected data.
Unfortunately, we couldn't recover all the original engagement measurements for that period. Discarding the records wasn't ideal either, since they still contained other useful information and researchers needed historical observations for backtesting. Instead, we preserved the values that had actually been collected and introduced additional fields for inferred measurements. Our data science team used statistical modeling and machine learning to estimate the missing or unreliable engagement values. These estimates were kept distinguishable from the original observations, rather than silently replacing them with numbers that appeared to be genuine measurements.
That distinction mattered for backtesting. An inferred value generated afterward isn't necessarily information that would have been available to a trading system at the time. Researchers needed to know which measurements were observed and which had been reconstructed, so they could decide whether those estimates were appropriate for a particular analysis.
We also changed our monitoring approach. Until then, we had relied too heavily on the assumption that valid responses contained valid measurements. After the incident, we introduced statistical checks against historical benchmarks for individual accounts, considering factors such as follower counts and expected engagement patterns.
The lesson was fairly straightforward. A pipeline can be technically healthy while producing unreliable data. Checking whether records arrive, whether their schemas are valid, and whether jobs complete successfully doesn't tell you whether the values themselves still make sense. When Smart Contracts Change Underneath You
Blockchain data introduced a different problem, particularly when working with upgradeable smart contracts. For many contracts, decoding event logs is relatively straightforward once you have the contract's ABI. But proxy contracts complicate things. The address users interact with can remain unchanged while the underlying implementation changes, potentially introducing new events or changing how existing functionality behaves.
We initially maintained ABIs against individual contracts and used them to decode incoming logs. This worked until one of the proxy contracts changed its implementation. Our decoding pipeline was still using the previous ABI, and some records could no longer be decoded correctly. Fortunately, ingestion and decoding were separate parts of the system. Raw blockchain logs continued arriving and were preserved in S3, while records that failed decoding were sent to a dead letter queue (DLQ). We had lost the ability to interpret those particular events correctly, but we hadn't lost the underlying records.
Once we identified the implementation change, we updated the ABI and replayed the failed records. That resolved the immediate problem, but it also exposed a weakness in how we managed contract metadata. Until then, we had effectively treated a contract's ABI as something that remained stable over time. We changed that approach and began maintaining historical ABI versions. This allowed us to retain the information needed to decode events against the contract implementation relevant to their historical context, rather than assuming the latest ABI would always be sufficient.
We also introduced validation during decoding. When incoming data no longer matched the expected ABI, the system could attempt to retrieve updated contract information instead of continuing with an outdated definition. Of course, an ABI mismatch doesn't always mean a proxy has been upgraded. Contracts can emit unfamiliar events, metadata can be incomplete, and not every proxy follows the same implementation pattern. The system still needed to handle cases where the correct interpretation couldn't be determined immediately.
What mattered was that a decoding failure didn't have to become a data loss incident. We could retain the raw observations, isolate the failed records, update the interpretation logic, and replay them once the issue was understood. This separation between collecting data and interpreting it became particularly valuable as we expanded coverage across different chains and smart contract ecosystems. Dealing with Blockchain Reorganizations
Blockchain ingestion had another problem: just because a block has been observed doesn't mean it will remain part of the canonical chain. For our use case, waiting for full finality before collecting data wasn't particularly attractive. Realtime trading systems, researchers and downstream traders needed relatively fresh observations, so we ingested blocks as they appeared, using multiple upstream sources in parallel.
That introduced a consistency problem. Different upstream nodes could temporarily disagree about the latest blocks, particularly during reorganizations. We couldn't assume that the first block received at a particular height would remain valid. We handled this at the ingestion layer by comparing block hashes across upstream sources and validating parent block relationships. These checks helped us identify inconsistencies when the observed chain history changed, rather than blindly continuing with whichever block arrived first. There wasn't one finality policy that worked across every network, either. Ethereum, other EVM compatible chains, and Solana have different finality characteristics, so ingestion behavior had to be adapted to each chain.
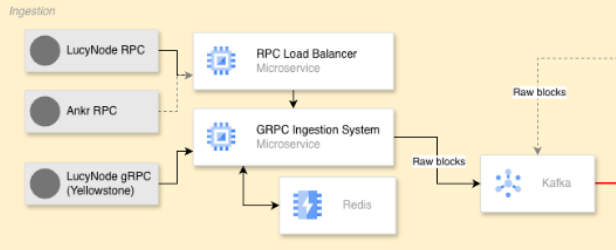
Fig: Architecture for Solana ingestion systems (RPC/GRPC)
Detecting a reorganization was only part of the problem, though. By the time an inconsistency was identified, some affected records might already have passed through multiple transformations and reached downstream datasets. When that happened, we contained the affected data and invalidated downstream outputs that could no longer be trusted. We then traced the dependencies through our data lineage, corrected the affected data, and restarted the relevant pipelines to refresh downstream datasets.
This is where maintaining lineage became particularly useful. Knowing that a particular block was no longer canonical wasn't enough. We also needed to understand which derived tables and downstream datasets depended on its records. Without that information, we would either risk leaving incorrect data in place or end up rebuilding far more of the platform than necessary. The difficult part was balancing freshness with correctness. We wanted to observe blockchain activity as early as possible, but early observations weren't necessarily final. We had to account for that uncertainty and maintain a way to recover when previously accepted observations changed. Learnings
These failures had different causes, but they exposed a common problem: we couldn't assume that data was correct simply because it came from a source we had successfully integrated. Twitter returned plausible but incorrect measurements. A proxy contract changed its implementation and invalidated our decoding assumptions. Blockchain reorganizations meant previously observed records could no longer be treated as canonical. In each case, the problem originated outside the normal execution of our processing pipelines.
Preserving raw data turned out to be one of the more useful decisions we made. It allowed us to revisit earlier transformations, replay failed records, and correct downstream datasets without always going back to the original source. That didn't solve every problem, as the Twitter incident demonstrated. Sometimes the original source had already supplied incorrect values, and no amount of reprocessing could recover information we never received.
We also learned to distinguish different kinds of correctness. Schema validation could tell us whether a record had the expected structure, but not whether its values were plausible. Successful decoding didn't necessarily establish that every interpretation was correct. And a block observed on chain wasn't necessarily final. The platform needed different safeguards for each of those problems, along with a way to identify affected datasets and recover when something slipped through.
Perhaps the biggest lesson was that data quality isn't something you can guarantee at ingestion and then forget about. It has to be considered throughout the data's lifecycle, from the source and its interpretation to the transformations, derived datasets, and eventual research use. And even with those safeguards, we couldn't guarantee that every observation would always be correct. What we could do was make problems easier to detect, preserve enough information to investigate them, and limit the damage when our assumptions turned out to be wrong.
Observability and Platform Operations
Operating a platform like this meant dealing with failures across several layers. A slow Spark job could be caused by an inefficient transformation, data skew, an overloaded node, or contention with another workload. A pipeline might fail because of an upstream API, or it might complete successfully while producing incorrect data. Looking at application logs alone wasn't always enough to understand what had happened.
We wanted a consistent way to observe the entire platform rather than maintaining separate monitoring systems for every component. We chose OpenTelemetry (OTel) as our common instrumentation and telemetry collection standard, with OpenObserve serving as the centralized backend. Collectors gathered telemetry from across the infrastructure, starting at the node and Kubernetes level and extending into individual services, Spark and Flink workloads, and application specific pipeline events. We collected metrics, logs, and traces, which were then made available through OpenObserve and visualized in Grafana.
One of the more useful capabilities was distributed tracing. A single workflow could involve ingestion services, Kafka, stream processors, batch transformations, and downstream datasets. Being able to follow an execution across those components made debugging considerably easier. We used trace context where available, alongside application IDs and log correlation when tracing couldn't cover the entire execution path. This was particularly relevant for distributed compute workloads. If a Spark backfill slowed down, we could look beyond the job itself and investigate executor behavior, node utilization, or infrastructure contention. Spark's execution level diagnostics were still useful, but centralized telemetry gave us a broader view of what was happening around the application.
We also configured alerts for infrastructure and application failures, along with data quality issues. As we'd learned from incidents involving unreliable source metrics, a healthy pipeline wasn't necessarily producing trustworthy data. Monitoring had to cover both system behavior and the quality of the datasets being published.
Not every alert required someone to intervene. Some failures could be handled by automated recovery mechanisms (like ABI change), while others required investigation by on call engineers. The observability system helped us identify where the problem occurred and provided the context needed to decide whether a retry was sufficient or whether the affected data needed to be contained and corrected.
The main core benefit isn't any particular dashboard or monitoring tool. It is having a consistent way to investigate failures across a platform made up of several different processing systems, without treating each component as an isolated service.
Governance and Self Service Access
One of the main goals of the Quant Stack was to let researchers work independently. We didn't want engineers to become a bottleneck every time someone needed access to a dataset, wanted to run an experiment, or required additional compute for a backfill. But giving researchers that flexibility came with its own challenges. We had multiple teams accessing different datasets, some of which required more restrictive access than others. We needed a way to manage permissions centrally without making researchers go through engineering for every request.
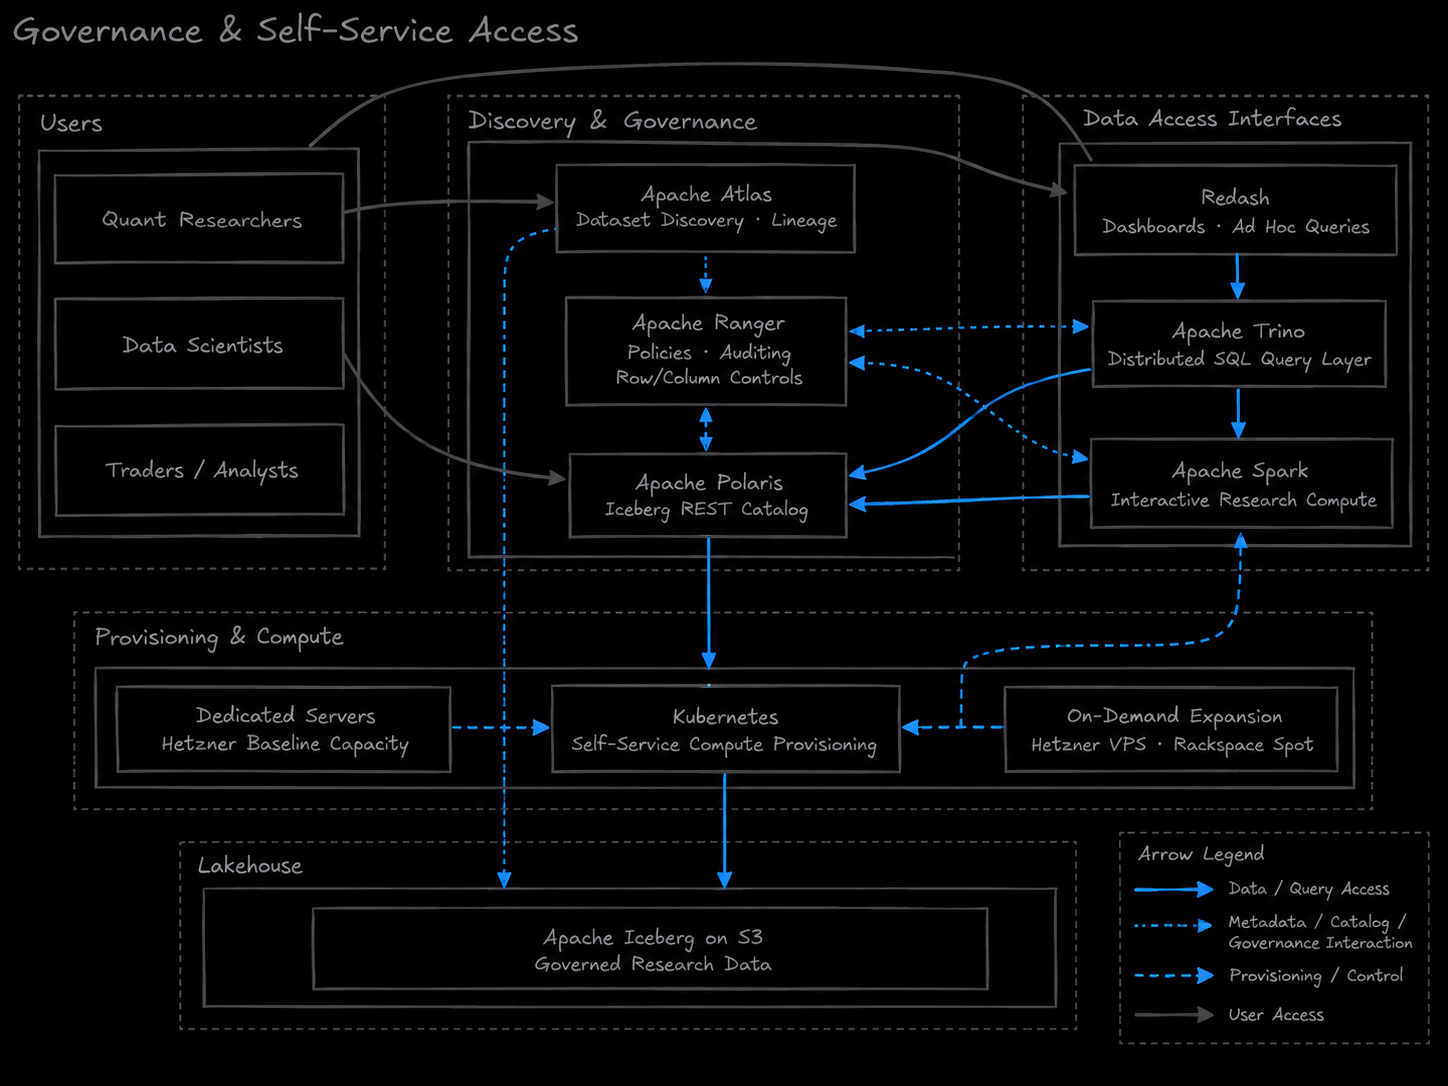
We used Apache Ranger for access policies and auditing, alongside Apache Atlas for metadata discovery and lineage. Our governance model included table-, column-, and row-level access restrictions, enforced through the appropriate integrations with our data access services. Atlas allowed researchers to discover available datasets in a controlled manner, while Ranger governed access to the underlying data.
That distinction was important. A researcher might need to know that a dataset existed, understand its schema, and inspect its metadata without necessarily being authorized to read every record or column inside it. Self service extended beyond data access. Researchers could provision their own compute environments through Kubernetes, including interactive Spark sessions for research and experimentation. They didn't need engineers to manually allocate servers whenever they wanted to run a workload.
We also provided different ways to access the data depending on what researchers were doing. Trino served as our distributed SQL query layer, while Redash provided a familiar interface for dashboards, reporting, and ad hoc queries. For more involved analysis, researchers could work with Spark directly using SQL or Python.
Our underlying infrastructure was a mix of dedicated and on demand capacity. Most predictable workloads ran on dedicated Hetzner servers, where we could maintain stable performance and costs. When additional compute was required, we could expand using Hetzner VPS instances or spot capacity from Rackspace. This was useful because research workloads were rarely predictable. Someone might need a small interactive environment for exploration, while another researcher could be running a substantial historical backfill. We didn't want to maintain enough permanent compute capacity for every possible peak workload.
Kubernetes handled the provisioning of those compute environments, while access to datasets was governed separately through our data access layer. This allowed researchers to work directly against centrally managed data instead of routinely downloading large datasets into their own research environments. It also addressed some of the governance problems we'd encountered earlier. When researchers copied data into local environments, revoking access or containing a problematic dataset became much harder. Keeping research compute connected to centrally managed data gave us better control over access and visibility into usage.
The result was a platform where researchers could discover datasets, query them through Trino and Redash, or provision Spark compute when they needed more flexibility. Engineering still maintained the infrastructure and governance mechanisms, but researchers didn't have to depend on us for every experiment.
What We Delivered
Over the course of the project, the Quant Stack grew from a handful of MVPs into a production data platform managing approximately 180 TB of data across multiple regions, processing over a billion events daily, and supporting twelve data products.
But the biggest improvement wasn't necessarily the scale. It was how researchers interacted with the platform. During the earlier stages, researchers often depended on engineers to prepare datasets, provision resources, or help them run more involved analysis. As the platform evolved, they could discover datasets, query historical records through Trino and Redash, and provision interactive Spark environments without having to request engineering assistance every time.
That was one of our original goals: to build a platform where researchers could explore ideas independently, rather than having the engineering team build infrastructure around every hypothesis. The architecture also made historical processing considerably more practical. Our Solana backfill workload, which previously took around nine hours per epoch, was reduced to approximately one hour and 48 minutes through the move to Spark and a series of processing optimizations. That was an 80% reduction, allowing researchers to work with historical data much sooner.
Three trading strategies were built and operated on top of the platform. There were also other independent research efforts, some of which used parts of the Quant Stack while maintaining their own implementations. Not every research project needed to use every component we had built, and that was fine. The platform was intended to provide shared data and compute capabilities, not dictate how every researcher should develop their models or strategies.
What I Would Do Differently Today
If I were designing the Quant Stack again, I would make data correctness a first class architectural requirement from the beginning, rather than treating it primarily as something to validate after ingestion. Early on, we focused heavily on collecting data reliably, processing it efficiently, and making it available to researchers. Those were necessary priorities, but some of our most difficult incidents came from situations where the pipelines were technically healthy while the underlying data was incorrect.
Today, I would establish explicit data contracts for each source, including assumptions about completeness, consistency, freshness, and how historical observations could change. I would also introduce independent checks for critical measurements earlier, particularly where upstream sources could silently change their behavior. That wouldn't eliminate incorrect data. We would still encounter source changes, blockchain reorganizations, and incomplete observations. But it would make our assumptions more visible and give us a better chance of detecting violations before they affected downstream research.
This article stayed at the level of architecture, trade offs, and lessons learned, partly because of confidentiality and partly because the full story would be far longer. I’ve left out low level implementation details, but I plan to cover some of them in follow up posts, such as how we approached point in time correctness for backtesting, the problem of entity resolution across sources (at a conceptual level), and operating Iceberg at scale.
Building the the Quant Stack was one of the most challenging and rewarding projects of my career, and the most productive stretch I’ve had so far. If you’re building something similar, I hope the failure modes and design decisions here save you some time.
Saurav Adhikari
Principal Quantitative Systems Engineer/Engineering Lead
108Capital PTE LTD, Singapore